Creating a Lightmap
A lightmap will visually display the performance of your light and allow for optimization for the best possible growing conditions for your specific crop. Measuring your light output in PPFD and displaying the values on a grid will show the distribution of PPFD.
Why have a Lightmap?
Depending on your needs you can create lightmaps to test a single lights performance or to test the amount of light (single or multiple lights) in your grow space.
You can use a lightmap to determine:
- True average PPFD
- Optimal light height
- Strength of your light on different settings
- Determine spots of low and high light strength
- Optimize distribution of light in your growroom
How is a Lightmap Created?
The performance of growing light can be described by collecting and processing data from the area under the light. A light (PPFD) measuring sensor is moved along a grid under the light. Light readings are taken at each point along the grid in the pattern that can be seen in Figure 1. The data is visualised using computer software.
Create your own Lightmap
We will take you through the process of recording data into a csv file and using our lightmap generator tool to visualize your data.
Requirements
- Light Sensor
- We recommend an Apogee Sensor, ePAR or PAR-FAR Sensor.
- However any light sensor will work as long as you can record the data.
- Light source
- Area to conduct light test
- Generally this will be your grow area or tent.
Data Recording with Light Sensor
The basic concept for recording light data is to setup a grid under your light source and record data at every point on the grid.
Figure 1

We will go through an example using an Apogee Sensor with the Bluetooth Micro-Logger and the Apogee Connect Mobile App.
- The Apogee PAR-Far sensor is placed at position 1 in Figure 1
- Record the light value using the manual data collection function of the Apogee Connect application.
- Move the sensor to the next position.
- Record the light value.
- Repeat step 3 and 4 until all data points have been recorded. (Refer to Figure 1)
- Export the data using the Apogee Connect application.
- Process the data using Green Houston Lightmap Generator Tool.
Data Formatting for Lightmap Tool
The format the data needs to be in is important.
CSV Format and Requirements
- CSV needs to be in decimal point format. (e.g 45.5 not 45,5)
- CSV needs to be in comma seperated format. (e.g value1, value2, ...)
- Light data needs to be in column form.
CSV Light Readings Example
You can create as many columns as you need for your data, when you upload your csv file, you will be able to choose which column you want to create your lightmap from.
Apogee PAR-FAR Sensor with multiple readings
| PAR | PFD |
|---|---|
| 305.69 | 313.713 |
| 342.36 | 351.35 |
| 393.21 | 403.62 |
| 377.56 | 387.71 |
| ... | ... |
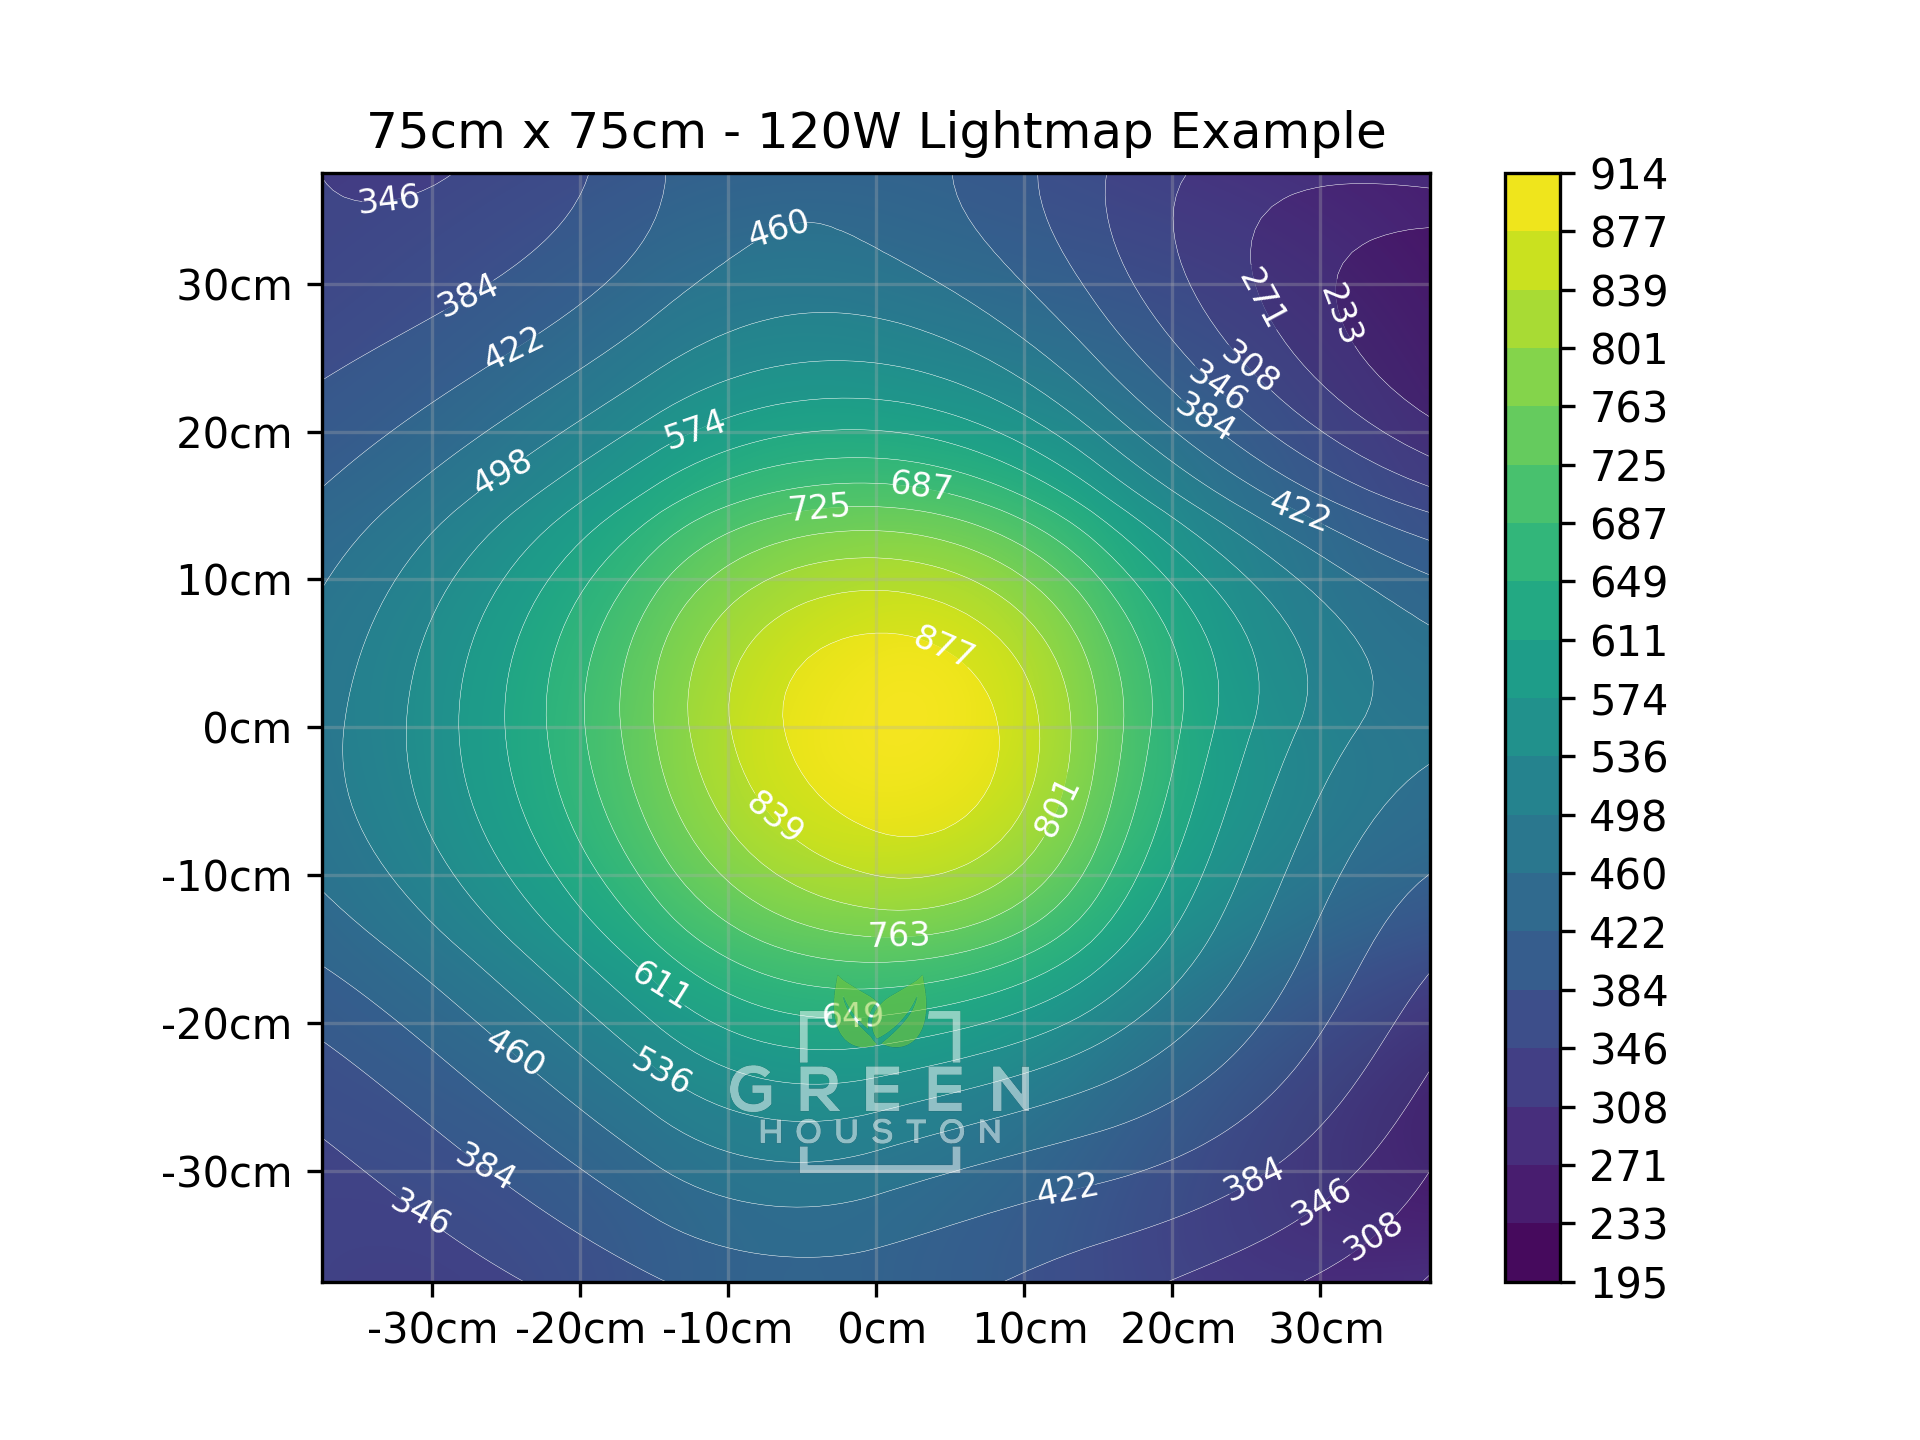
Generate Lightmap
You can use our Lightmap Generator Tool to upload a csv file and get a PNG Lightmap.
After uploading your csv, you should get a lightmap similar to this: