Determining Light Height

Determining the ideal light height includes peforming light tests at multiple heights and deducing a meaningful relationship between the Average PPFD, Corner PPFD and Centre PPFD values at different heights. PPFD values are recorded under a light at multiple heights, the data is then transformed into useful information.
Why have a Light Height Graph?
A light height graph will show you the corner, centre and average PPFD of your light at different heights. This data will allow you to determine the best possible height where your corner and centre PPFD values are closer together while still maintaining a high average PPFD.
After analyzing your light height graph, you will be able to know at which height your light performs the best. With this you can then generate a lightmap to show the spread of PPFD and perfromance of the light over your entire growing area.
How is a Light Height Graph Created?
The performance of growing light can be described by collecting and processing data from the area under the light. A light (PPFD) measuring sensor is moved along a grid under the light. Light readings are taken at each point along the grid in the pattern that can be seen in Figure 1. This process is repeated for different heights, at least 3 different heights (low, medium and high). The data is visualised using computer software. We take the PPFD values at each height and turn them into Average, Corner and Centre PPFD values at multiple heights.
Creating a Light Height Graph
We will take you through the process of recording data into a csv file and generating a line graph displaying the average, corner and centre PPFD values at multiple heights.
Requirements
- Light Sensor
- We recommend an Apogee Sensor, ePAR or PAR-FAR Sensor.
- However any light sensor will work as long as you can record the data.
- Light source
- Area to conduct light test
- Generally this will be your grow area or tent.
- Minimum of 3 different light heights
- Low, medium and high light heights
- These light heights are measured as though they were Xcm from your canopy.
Data Recording at Different Heights with a Light Sensor
The basic concept for recording light data is to setup a grid under your light source and record data at every point on the grid. However to reduce time and effort, you will only need to record a quandrant of the tent.
Figure 1
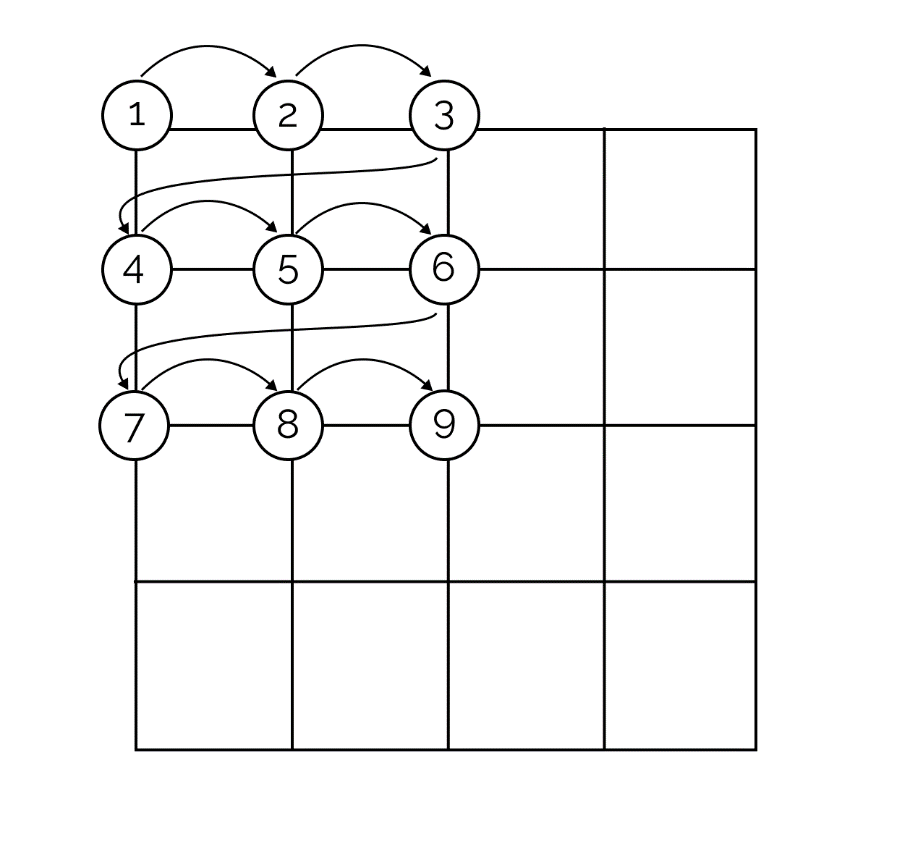
We will go through an example using an Apogee Sensor with the Bluetooth Micro-Logger and the Apogee Connect Mobile App.
- Place a grid under the light.
- centre the light
- The Apogee PAR-Far sensor is placed at position 1 in Figure 1
- Record the light value using the manual data collection function of the Apogee Connect application.
- Move the sensor to the next position.
- Record the light value.
- Repeat step 5 and 6 until all data points have been recorded. (Refer to Figure 1)
- Export the data using the Apogee Connect application.
- Repeat the process for multiple heights and combine the data into a CSV file.
- Process the data using Green Houston Light Height Generator Tool.
Data Formatting
The format the data needs to be in is important.
CSV Format and Requirements
- CSV needs to be in decimal point format. (e.g 45.5 not 45,5)
- CSV needs to be in comma seperated format. (e.g value1, value2, ...)
- Data needs to be in column form.
- Each column must have a heading representing the light height (cm) followed by their respective PPFD readings in the subsequent rows. Integer format (don't include cm unit only the number e.g 45 not 45cm).
CSV Light Height Example
Your data should look like the table below, you can create as many columns as you need for your data. Each column represents the readings of your light at a specific height. Make sure each column has a heading, value is the height at which the light was at. The heading value should be an integer. Export your data into a CSV file.
Light Height readings at 15cm, 30cm, 45cm and 60cm
Make sure column headings are in
Integer Format
| 15 | 30 | 45 | 60 |
|---|---|---|---|
| 262 | 437 | 451 | 398 |
| 282 | 486 | 489 | 424 |
| 291 | 516 | 515 | 449 |
| 549 | 629 | 563 | 470 |
| 748 | 810 | 661 | 526 |
| ... | ... | ... | ... |
Generate Light Height
You can use our Light Height Generator Tool to upload a csv file to view, interact and download a line graph.
After uploading your csv, you should get a light height graph similar to this: